
Walk This Way: The Impact of Walkability on Real Estate Prices

Over the past 20 years, REIN’s research has revealed that real estate values are driven both up and down by eight demographic fundamentals, of which transportation improvement is one of the most dramatic catalysts. The basic theory in real estate is that the more attractive the location, the higher the value of the home. As the demand for homes in that area expands, the result is higher housing values. In 2007, the first edition of The Gateway Effect was released by REIN. It was a report that outlined how transportation improvements in Vancouver had a positive effect on the valuations of properties located near these transportation changes.
Since that time, REIN has applied the same fundamentals to transportation improvements occurring in: Calgary; Edmonton; Toronto; Kitchener; Hamilton; and most recently, Ottawa. Each report lists the transportation improvements happening in the region, and the surrounding communities that should witness a 10%-20% positive value and rental premiums in comparison to communities that are located farther away from these improvements. REIN’s key finding was that distance is no longer measured in kilometres, but in minutes. Proximity to amenities – an area’s accessibility – has become one of the key determinants of a property’s value. This is why new builds like this Shapoorji Joyville Hadapsar apartment has focused so much on providing amenities for people interested in the building. They have ensured the residents will have amenities both on-site and close by to ensure maximum satisfaction.
The automobile should no longer be the only form of transportation that should be on an investor’s radar. If accessibility is one of the key determinants of real estate demand for a region, why not take it one step further and look into the impacts of an area’s walkability on property prices?
Walka What?
Walkability can be defined as: “The extent to which the built environment is friendly to the presence of people living, shopping, visiting, enjoying or spending time in an area.” The closer an area is to amenities, the more ‘walkable’ the area is.
Measuring an Area’s Walkability
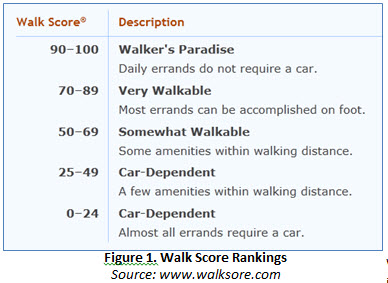
Launched in 2007, www.walkscore.com uses an algorithm to calculate an address’s walkability. An area is given a score between 0 to 100 depending on the number of amenities located within a one mile (or 1.6 kilometre) radius from an address. Destinations get maximum points if it is one quarter mile or less from the residence and record zero points if they are over one-mile away. The higher the score, the more walkable the area. Walk Score has included a list of amenities that improve a location’s walk score on its website:
– A Centre: Walkable neighborhoods have a center, whether it’s a main street or a public space.
– People: Enough people for businesses to flourish and for public transit to run frequently.
– Parks and public space: Plenty of public places to gather and play.
– Pedestrian design: Buildings are close to the street, parking lots are relegated to the back.
– Schools and workplaces: Close enough that most residents can walk from their homes.
– Complete streets: Streets designed for bicyclists, pedestrians, and transit.
The algorithm has turned an abstract idea into a measurable quality. A property’s walkability can now be compared to another property, neighbourhood, or city.
 Walk Score’s Increase in Popularity
Created as a tool to help people decide the best locations to live, the website’s popularity has grown exponentially since its inception. In fact, many realtors now include walk scores in their property listings. When websites like this pop up for the benefit of businesses and individuals, this can be a huge benefit for those who use it as well as the websites’ owner/s, so keeping on top of the maintenance and design of the website is incredibly important, that is why Website Maintenance Services, as well as other resources, are used for this to be a reality.
Location a Top Housing Consideration
A recent study by Belden, Russonello, and Stewart found that 58% of American adults would prefer to live in a neighborhood with a mix of houses, stores, and other businesses within a short walk over a neighbourhood with just a short driving commute time to work or a rural neighbourhood . A poll by
Toronto-based Forum Research revealed that 57% of Torontonians would pay an annual household fee to cut their trip to work or school .
Investors who have been performing their due diligence will have noticed that younger generations are or can be increasingly disinterested in automobiles as a form of transportation. Since 2001, Generation Y’s use of the automobile has declined, but bike and mass transit use has increased dramatically. Between 2001 and 2009, the average Gen Yers use of public transportation rose by 40%, bike use rose by 24%, and walking increased by 16% .
The figures were even higher for young people from wealthier households; for younger people with incomes over $70,000, public transit use increased by 100%, biking jumped by 122%, and walking rose by 37% . This is likely correlated to large cities that tend to have higher average wages, which incidentally have either excellent transit opportunities (New York) or have fair weather (Los Angeles). As prices rise and the world’s population grows, integrated communities will continue to grow in popularity – and not just for those strapped for cash.
Accessibility to Jobs, Transit, and Recreation Increases as Walkability Increases
As expected, residents of more walkable neighbourhoods have lower transportation costs and higher transit access. Lesser known is the fact that these residents also have access to more jobs. The Brookings study found residents in neighbourhoods on Level 4 of the walkability scale can access on average over 15 per cent more jobs in the region within 90 minutes than residents in neighbourhoods ranked at level 3, and 21 per cent more jobs than residents in neighbourhoods ranked at level 2 on the walkability scale . As time is now measured in minutes, not kilometres, it’s easy to see why people are attracted to neighbourhoods that achieve high Walk Scores ‘ residents in these neighbourhoods spend less time traveling to their destinations and have access to an increased list of amenities.
Why should Investors Care about Walk Scores?
Up until the mid 1990s, suburban homes only accessible by car were a sign of social status, costing more per square foot than any other type of housing. Today, some of Canada’s most valuable real estate can be found in urban locations with high Walk Score rankings.
So, is there a correlation between the walkability of a city and that city’s average real estate prices? The latest research shows that there is indeed an association between a neighbourhood’s Walk Score and the value people place on real estate in that neighbourhood.
Walkability Increases Average Real Estate Prices
A study published by the Brookings Institution in May of 2012 focusing on Washington, DC found that the more walkable a neighbourhood was, the better it performed economically. Using five levels of walkability similar to those developed by Walk Score (Figure 1 in this article), the Brookings study determined that as walkability increased, so too did average real estate prices. On average, a one-level increase in walkability was found to add $7 per square foot to annual retail rents, $9 per square foot to office rents, $300 per month to apartment rents, and almost $82 per square foot to average home values .
A 2009 study conducted by CEOs for Cities discovered that homes with above-average levels of walkability commanded home values about $4,000 to $34,000 over houses with just average levels of walkability. An increase of one-point on the Walk Score scale (between 0 and 100) was associated with a $700 to $3,000 growth in that neighbourhood’s real estate values. Property values for homes with access to extensive public transit experienced the highest property value premiums, suggesting that value gains associated with walkability are the highest when residents have alternatives to living without an automobile .
The city of Calgary has seen inner city neighbourhood real estate prices skyrocket in recent years as people become fed up with long commute times from outer suburbs. Between 2000 and 2012, the ten communities that saw the largest spikes in average home prices were in the city’s core and surrounding neighbourhoods. Of these ten neighbourhoods, the average home price increased between 205-260% – a result that the Calgary Real Estate Board (CREB) says is directly linked to proximity to more amenities and an increase in alternate transportation options .
CREB president, Becky Walters, told Calgary Sun reporters that the reason behind the increase is access – access to the downtown, access to work, access to transit. People in that younger demographic, pre-children with two incomes, are looking at the ability to have access to everything. It really is that lifestyle.
Homes in Walkable Neighbourhoods Retain their Value
The results of another study conducted by Brookings Institution showed that homes in urban neighborhoods with a high level of walkability experienced less than 50 per cent of the average decline in price from the housing peak in the mid-2000s.
Important Investor Note: Walkable Spaces benefit from being near other Walkable Spaces
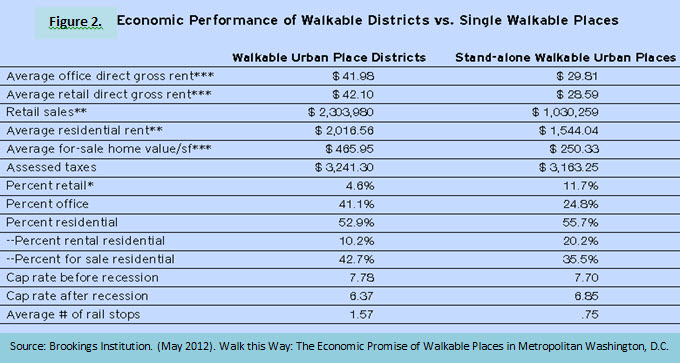
Enticed by the cash flow potential of a walkable neighbourhood? Not every neighbourhood with a high Walk Score will perform equally. The Brookings Institution study also found that a walkable neighbourhood close to other walkable neighbourhoods performed better economically than a walkable neighbourhood standing alone. Combining adjacent walkable neighbourhoods into districts, the study found that these clustered neighbourhoods commanded 47 per cent more in retail rents, nearly 41 per cent more in office rents, and approximately 31 per cent more in residential rents. In addition, residential values in walkable districts were 86 percent higher per square foot on average than a stand-alone walkable neighbourhood . To determine if your neighbourhood is part of a walkable district, make note of the Walk Scores of adjacent neighbourhoods – are they a level 1, 2, 3, 4, or 5? If neighbourhood adjacent to your property also receive a high Walk Score, it is more than likely that your investment area qualifies as a walkable district.
How to Use Walk Score to Your Advantage
Investors can use Walk Score to attract more prospects to their properties by:
1) Buy rental property within 800 metres of an LRT station
Homes within this radius tend to command 10-20% more in value and in rent than similar homes outside of the area.
2) Adding Walk Scores to Your Website
You can add the Walk Score Neighborhood Map to your site’s HTML or ask your website maintenance company to add it.
3) Adding Walk Scores to Your Craigslist and Kijiji Rental Ads
You can create a Walk Score Badge for any address. Just enter your property’s address and then copy and paste the provided code into your Craigslist post.
4) Listing Your Rental Properties on Walk Score
Walk Score offers featured rental listing services for Walk Score Apartments & Rentals.
5) Becoming a Local Expert
Become a “Local Expert” in a neighborhood and/or city on www.walkscore.com by adding at least 10 places with a picture and a comment. The user with the most places in an area will be featured on that city’s Walk neighborhood pages.
For more information on all of the services Walk Score offers real estate investors, please visit www.walkscore.com/professional/real-estate-professionals.php
In this fast-paced world, demand for increased accessibility will only continue to grow. The automobile should no longer be the only form of transportation that should be on an investor’s radar.
 Allyssa first joined the REIN team in 2008 as a research assistant. In the past four years, Allyssa has contributed to many of REIN’s research reports, including: the Top Alberta Investment Towns report, Top Ontario Investment Towns report, the Gateway Effect, Calgary Transportation Effect, and Edmonton Transportation Effect.
1Steve Abbey. (February 2005). ‘Walkability Scoping Paper.’ Retrieved from http://www.levelofservice.com/walkability-research.pdf
2Belden, Russonello, and Stewart. (March 2011). The 2011 Community Preference
3Kalinowski, T. (March 11, 2013). Commuting and transit: 66% would pay more to cut their trip to work or school, new poll finds. Retrieved from http://www.thestar.com/news/gta/2013/03/02/commuting_and_transit_66_would_pay_more_to_cut_their_trip_to_work_or_school_new_poll_finds.html
4Read, Richard. (June 18, 2012). ‘Young People Are Driving Much Less (But Not For The Reasons You Think).’ Retrieved from http://www.thecarconnection.com/news/1077028_young-people-are-driving-much-less-but-not-for-the-reasons-you-think
5Ibid
6Ibid
7Leinberger, C. & Alfonzo, M. (May 2012). ‘Walk this Way:The Economic Promise of Walkable Places in Metropolitan Washington, D.C.’ Retrieved from http://www.brookings.edu/~/media/Research/Files/Papers/2012/5/25%20walkable%20places%20leinberger/25%20walkable%20places%20leinberger.pdf
8Cortright, J. (August 2009). -How walkability raises home values in U.S. cities.’ Retrieved from http://blog.walkscore.com/wp-content/uploads/2009/08/WalkingTheWalk_CEOsforCities.pdf
9Logan, S. (February 22, 2013). ‘Inner city rebirth has prices on the rise, but population growth hasn’t kept pace.’ Retrieved from http://www.calgarysun.com/2013/02/22/inner-city-rebirth-has-prices-on-the-rise-but-population-growth-hasnt-kept-pace
10Doherty, P. & Leinberger, C. (November 2010). ‘The next real estate boom.’ Retrieved from http://www.brookings.edu/research/articles/2010/11/real-estate-leinberger
11Leinberger, C. & Alfonzo, M. (May 2012). ?Walk this Way:The Economic Promise of Walkable Places in Metropolitan Washington, D.C.? Retrieved from http://www.brookings.edu/~/media/Research/Files/Papers/2012/5/25%20walkable%20places%20leinberger/25%20walkable%20places%20leinberger.pdf
All Access


")
")